
AI productivity paradox — work feels faster, so why don’t the numbers move?
Contents
We answer why, despite abundant testimony that AI makes specific tasks markedly faster, its effect isn’t visible in company- and economy-wide productivity statistics. This isn’t new—it's a structural gap that has recurred since the early days of computers.
At a glance
| Item | Details |
|---|---|
| Phenomenon | Individual task speed feels faster, but aggregated productivity metrics at the firm/economy level barely move |
| Representative surveys | PwC Global CEO Survey, NBER executive survey (2026) |
| Core mechanisms | Reabsorption of saved time, measurement lag (J-curve), limits from task share |
| Historical precedent | Solow’s 1987 “productivity paradox of the computer age” |
| Estimated magnitude | Total factor productivity over 10 years: 0.5~0.7%p (Acemoglu estimate) |
Background — why this gap matters now
Since the adoption of generative AI, testimonies and experiments showing tangible effects at the level of individual tasks have been consistent. Yet firm-level surveys published in 2026 paint a contrasting picture. In PwC’s January 2026 Global CEO Survey of 4,454 CEOs across 95 countries, only about 12% said they had seen material effects from AI on both costs and revenue, while more than half said there had been no financial impact yet (PwC). Around the same time, an NBER study surveying about 6,000 executives in the US, UK, Germany, and Australia reported that roughly 90% of respondents had not perceived changes in productivity or employment from AI over the past three years (Fortune).
Over the same period, experiments at the level of discrete tasks report the opposite. In narrow tasks such as coding, customer support, and writing, studies repeatedly find double-digit gains in throughput after AI adoption. The problem is that these task-level speedups are not easily translating into aggregate outcomes like total company revenue or national productivity statistics.
Why do the numbers diverge like this
1) Saved time gets reabsorbed
Finishing one task faster doesn’t mean that time remains free. Rework to review and edit AI outputs, increased workload, and newly created coordination tasks often reabsorb the saved time. At a personal level, “it’s faster” may be true, but unless that time converts into higher output at the team or organizational level, it won’t show up in aggregate statistics.
2) Measurement lag — the productivity J-curve
The oldest framework for this gap is Robert Solow’s 1987 observation. Solow noted that “you can see the computer age everywhere but in the productivity statistics.” MIT’s Erik Brynjolfsson and colleagues generalized this into the “productivity J-curve”: in the early phase of adopting a general-purpose technology, firms pour resources into intangible assets like organizational redesign and skills formation, leading official statistics to undercount output; only later, when those intangibles accumulate and start delivering services, does measured productivity catch up (NBER, Brynjolfsson·Rock·Syverson). That said, the J-curve is a model-based explanation, and economists disagree on whether the delayed effect will materialize as predicted.
3) Limits from the share of affected tasks
MIT’s Daron Acemoglu applies the share of tasks affected by AI and the per-task cost reduction to a macro growth framework, offering a conservative estimate that AI will raise total factor productivity by at most 0.5~0.7%p over the next 10 years. This sharply contrasts with more optimistic multi-trillion-dollar projections from Goldman Sachs and McKinsey (NBER, Acemoglu). Analysis: If this estimate is right, even dramatic speedups felt in individual tasks can be diluted at the economy level because the share of tasks AI affects is still small.
Implications for Korea
In February 2025, the Bank of Korea estimated in an issue note that AI diffusion has the potential to raise total factor productivity by 1.1~3.2% and GDP by 4.2~12.6%, based on a model (Bank of Korea). In a July 2026 report, KDI estimated a cumulative total factor productivity gain of 1.5~3.5% over the next 10 years, while also projecting that annual job losses could reach 256,000, equivalent to 2.1% of employed persons over the same period (Newsis). Both estimates are model-based potentials rather than observed outcomes, echoing the earlier CEO/executive surveys’ message of “not yet felt.” Given Korea’s industrial structure with a high manufacturing share, the relatively lower AI exposure is also cited as a factor widening this gap.
Outlook and key variables
- Positive variable: If the J-curve story holds, delayed effects may surface as organizations enter the phase of redesigning workflows around AI.
- Risk variable: If rework/reabsorption isn’t resolved, task-level speedups may remain permanently decoupled from aggregate statistics.
- Checkpoints: Watch whether the share of “tangible financial impact” responses inches up in the next CEO/executive surveys, and whether firms are changing workflows themselves alongside AI adoption.
Conclusion
- The perceived speedup of individual tasks and aggregate firm/economy statistics measure different things, so they have no reason to align immediately.
- This gap isn’t unique to AI; it’s a classic pattern in general-purpose technology adoption, seen since Solow’s 1987 paradox.
- Distinguishing among reabsorption of saved time, measurement lags, and task-share limits helps avoid conflating “no effect” with “not visible yet.”
References
Contents
Related posts

Call center AI adoption, why does it end in rollback — failure patterns and how to avoid them
Based on a recent survey showing 74% of companies roll back call-center AI chatbots, we contrast Klarna’s failure without escalation design and Carmoola’s success with preset criteria, distilling three recurring causes.
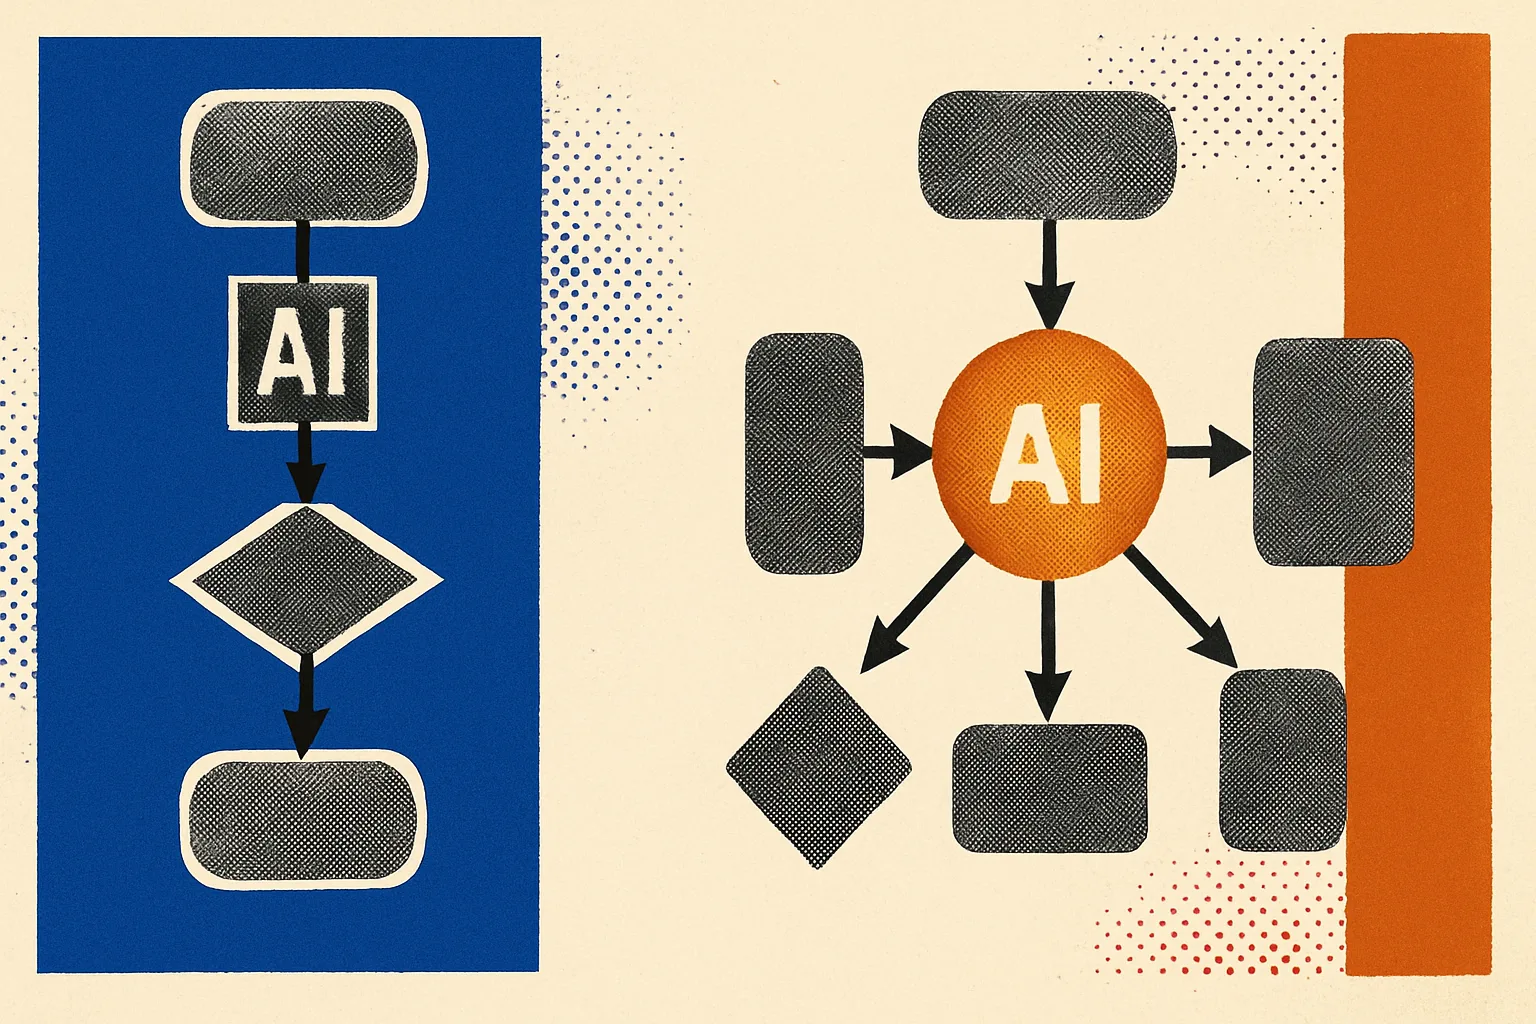
Why the same AI adoption leads to different outcomes — the difference between redesign and adding tools
Even with the same generative AI, results diverge depending on whether teams rewired their workflows. Using McKinsey, BCG, and Deloitte data, we pinpoint where and why redesign-led and tool-addition approaches split.

Why AI pilots stall before enterprise scale — five recurring traps
88% of companies use AI, but only ~6% report enterprise-wide financial impact. McKinsey, MIT, and Gartner flag five traps blocking pilots: data quality, process misfit, lagging governance, legacy integration, and change management.
Why do AI pilots stall before enterprise-wide scaling — five recurring pitfalls
88% of firms use AI, but only about 6% report enterprise-wide financial impact. McKinsey, MIT, and Gartner cite five traps: data quality, process misfit, lagging governance, legacy integration, and change management.